Gemology evidence note
AI in Gemology: How Machine Learning Identifies Gemstone Provenance
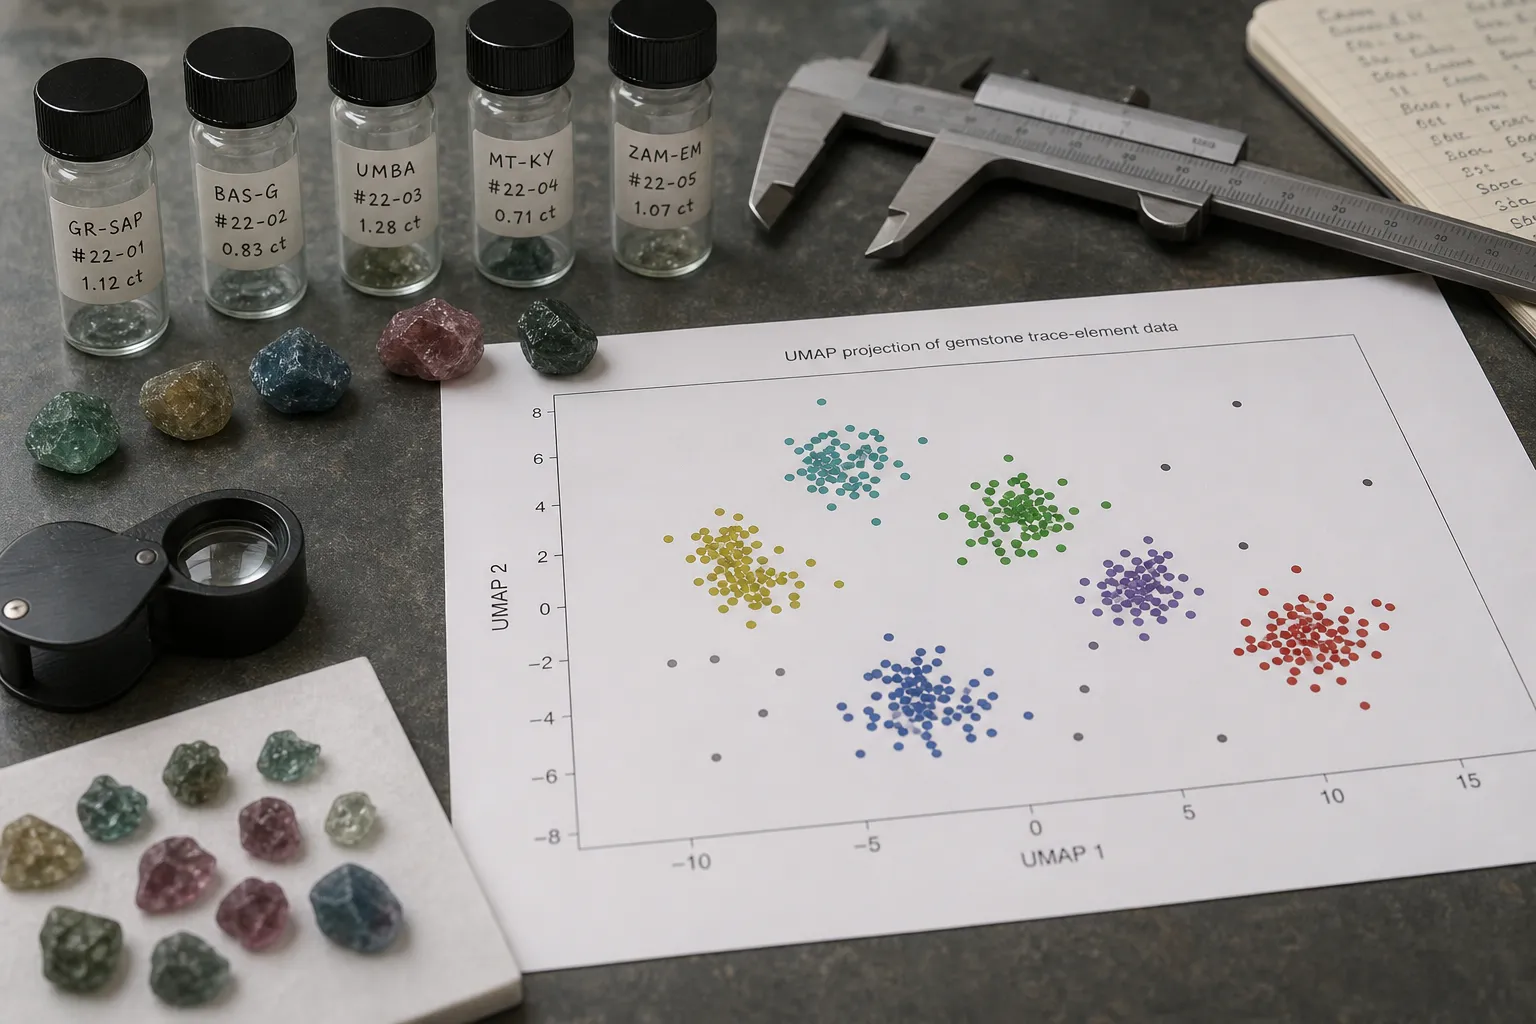
Machine learning can help gemology readers make sense of gemstone provenance data by turning complex chemical measurements into visible patterns. In a UMAP Gemstone Classification workflow, measured features from gemstone samples are plotted so that similar samples tend to appear closer together. That can make clusters, outliers, and possible locality relationships easier to discuss.
The limit matters: UMAP does not determine origin by itself. It is a pattern-exploration tool. A cluster on a chart is not a certificate, a locality decision, or a replacement for validated laboratory evidence and expert interpretation.
broader context
Begin with the main amethyst page
This narrower page lands better after the broader amethyst context page.
What UMAP Is Actually Doing
UMAP is a dimensionality reduction method. In plain language, it takes data with many measured variables and compresses those relationships into a simpler visual form, often a two-dimensional scatter plot.
For gemstone provenance analysis, the input would usually be structured geochemical data: measured elements, trace-element relationships, spectroscopic features, or other numerical information prepared for comparison. The goal is not to make the stone “speak” its origin. The goal is to ask whether an unknown sample looks similar to samples whose sources are already known.
That distinction is easy to miss. A gemstone does not carry a readable address label. Provenance work asks whether the stone’s measurable characteristics are consistent with material from a known source area. UMAP can help show those relationships when the dataset is strong enough, but it only arranges the data it is given.
This is why “UMAP Gemstone Classification” can sound more decisive than the method really is. The classification depends on measurement quality, reference samples, feature selection, model settings, and interpretation. UMAP may reveal a useful pattern; it does not independently know where a gemstone formed.
From Measurements to a Provenance Pattern
A cautious machine-learning workflow in gemology is better understood as a sequence, not a single AI answer.
- Reliable measured data comes first. The exact method depends on the gemstone type and the research question, so it would be too broad to say that one instrument or one measurement category is always enough. The basic requirement is structured numerical input that is relevant to the provenance question.
- The data has to be prepared. Measurements may need cleaning, scaling, selection, or transformation before an algorithm compares them. This step is not just technical housekeeping. If one variable dominates the dataset, the final plot may emphasize that variable rather than a meaningful locality signal.
- An unsupervised algorithm can project the data. UMAP can move the data into a simpler visual space. “Unsupervised” means the method is looking for structure without being handed the correct origin label for every unknown sample during the mapping step. That can be useful when researchers want to see whether known samples form groups or whether an unknown sample falls near one of those groups.
- The plot still needs gemological interpretation. If several stones sit close together, the next question is why. They may share a geological source, but they may also share overlapping chemistry, similar preparation history, incomplete reference coverage, or a modeling choice that emphasizes certain features.
- The pattern needs validation. A clean-looking map can be helpful, but it is not enough on its own. Strong provenance interpretation depends on appropriate reference material, transparent methods, uncertainty awareness, and comparison with other gemological evidence.
UMAP, t-SNE, and the Map Problem
UMAP is often mentioned beside t-SNE because both are used to visualize high-dimensional data. For a gemology reader, the key point is not which acronym is newer or more technical. Both can make hidden structure easier to see, and both can produce plots that look persuasive.
Dimensionality reduction changes the form of the data. It compresses many measured variables into a simpler view. That helps the eye, but compression always involves choices and tradeoffs. Two points appearing close together may be similar under the model’s setup; that does not automatically mean the stones came from the same mine, region, or deposit.
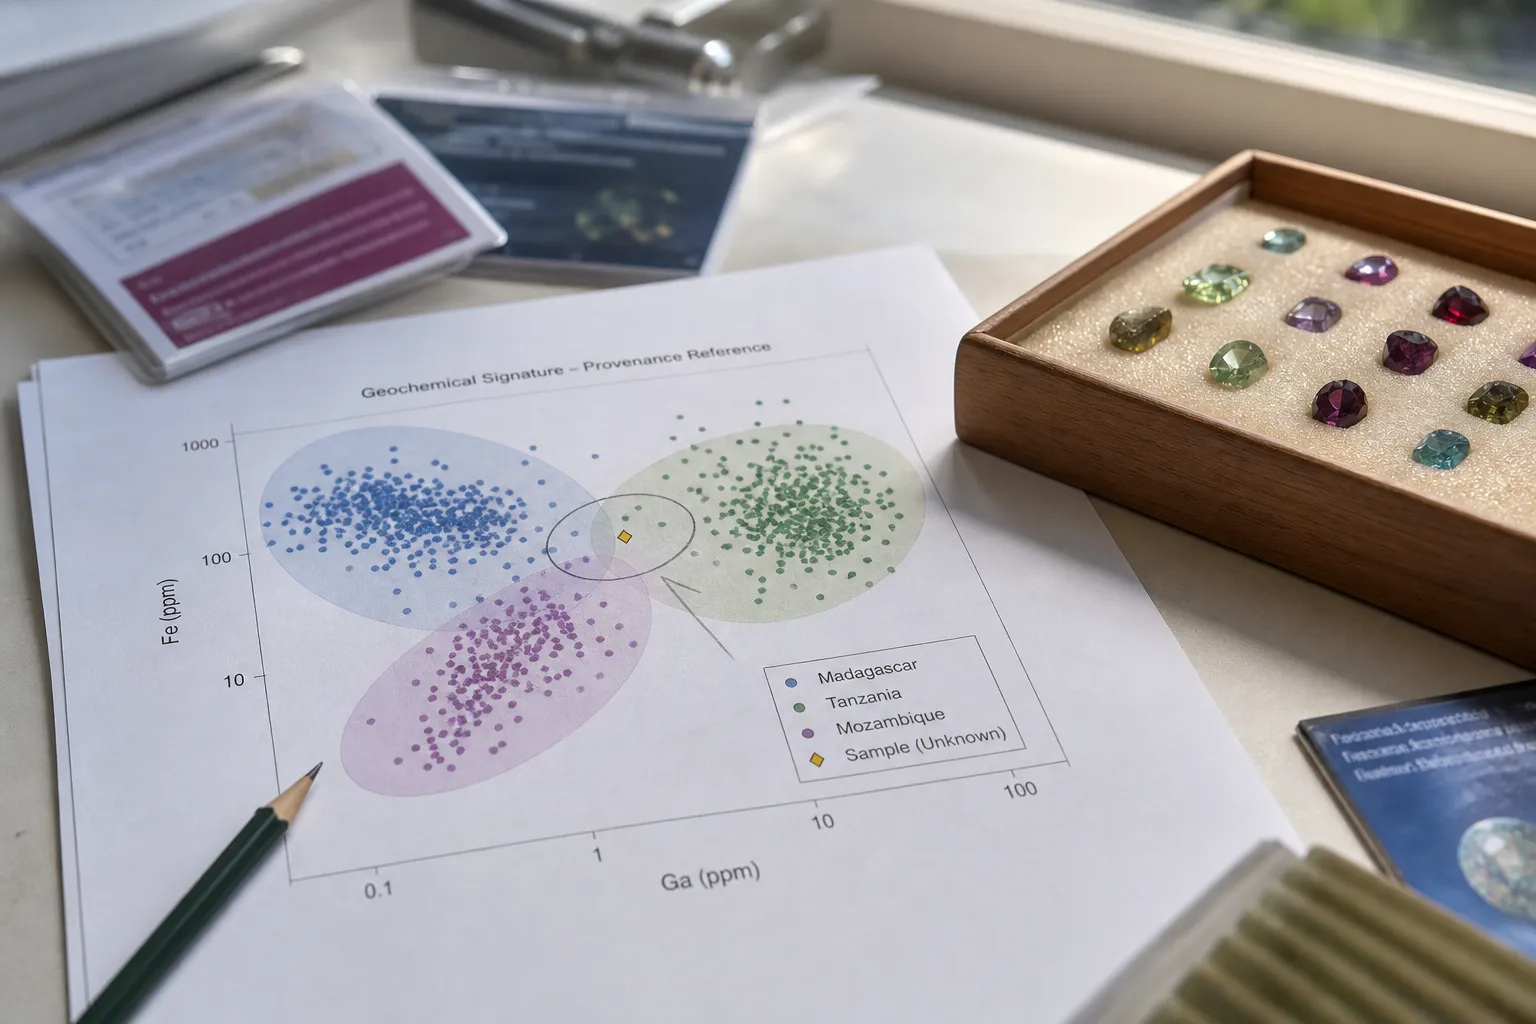
This is where gemstone data visualization can mislead casual readers. A scatter plot with colored clusters feels intuitive. If one color represents a known locality and an unknown point falls inside that cluster, the answer may look obvious. In practice, gemstone locality limitations are more complicated. Deposits can overlap chemically. Reference datasets can be incomplete. Some samples sit between groups. Treatment history, condition, or data handling can affect the pattern.
UMAP and t-SNE can support provenance pattern exploration. They should not be treated as stand-alone authorities.
What Makes the Result Stronger or Weaker
Reference set
If the dataset includes well-characterized samples from relevant localities, the pattern may be more informative. If the reference material is sparse, poorly labeled, or not comparable to the unknown stone, the visualization becomes much weaker.
Data quality
Machine learning cannot rescue unreliable measurements. If the input is inconsistent or not suited to the provenance question, the output may organize noise or irrelevant variation.
Feature choice
A gemstone contains many measurable properties, but not every property helps separate origin. Some variables may carry useful geological information; others may not. Without validated support for a specific gemstone and source question, it is safer to avoid claiming that any single element, ratio, or measurement always identifies locality.
Model setup
UMAP uses parameters that influence how local and broader relationships appear. Different settings can produce different arrangements. That does not make the method useless, but it does mean the plot should be read as part of an analytical process rather than as a fixed picture of truth.
The final condition is interpretation. Provenance is not only a data-science problem. Mineral type, geological formation, inclusions, treatments, source overlap, and market labeling habits can all affect how a result should be understood. The machine-learning plot may support the discussion; it should not replace it.
Common Misunderstandings About AI Origin Claims
“AI identified the origin” sounds more certain than the evidence allows.
A more careful version would be: AI-assisted visualization may help compare an unknown sample with known geochemical classification patterns, if the data and reference set are suitable.
Unsupervised algorithms do not discover real-world categories by themselves.
They find mathematical structure in the supplied data. Sometimes that structure may correspond to meaningful provenance groups. Sometimes it may reflect another difference in the dataset. The model does not know which explanation is gemologically correct.
Visual separation is not the same as certainty.
A plot may show two groups apart from each other, but the separation still needs context. How many samples were included? Were the locality labels reliable? Were measurements comparable? Were overlapping sources considered? Without those answers, a clean visualization can create more confidence than the evidence supports.
The same approach does not work equally well for every gemstone.
Some stones and source questions may be better suited to geochemical comparison than others. Some localities may overlap too much for a simple visual separation. Some commercially important questions require laboratory methods and professional reporting standards beyond a basic visualization.
For collectors, the practical distinction is important. A provenance plot can be intellectually useful without being a buying guarantee. It may explain why researchers look across many measured features at once. It should not be used as a shortcut for authenticity, value, rarity, or ethical sourcing claims unless those claims are supported through stronger evidence.
How to Read a UMAP Gemstone Plot
- Start with the points. Are they individual gemstone samples, repeated measurements, or averaged groups?
- Look at the colors. Do they represent known localities, gemstone varieties, treatments, or something else?
- Check the reference basis. A plot built from transparent, relevant, well-characterized samples is more useful than one built from a small or unclear dataset. Without a solid reference set, even a polished visualization cannot carry much provenance weight.
- Notice the wording around the plot. Careful language usually says a sample is consistent with a pattern, appears near a reference group, or warrants further comparison. Overconfident language suggests the algorithm has settled origin, authenticity, value, or sourcing status by itself. That is more than a cluster plot can responsibly support.
- Look for uncertainty. Good provenance interpretation leaves room for overlap, outliers, incomplete data, and ambiguous samples. A method that never admits uncertainty is not necessarily stronger; it may simply be presenting the result too aggressively.
Bottom Line
UMAP-style machine learning can help gemology by making complex geochemical relationships easier to see. It may reveal clusters, outliers, and gemstone provenance patterns that deserve closer study.
Its boundary is just as important: UMAP arranges data; it does not determine gemstone origin on its own. The meaning of the arrangement depends on measurements, reference samples, preparation choices, model settings, and gemological review.
For a collector-minded reader, the takeaway is simple. AI can make provenance patterns easier to discuss, but a gemstone’s origin remains an evidence question. The strongest interpretation comes from validated data, careful comparison, and clear limits—not from the visual appeal of a cluster plot.