Gem lab interpretation
Inside the Gem Lab: How Spectroscopic Baselines Catch Treated Crystals
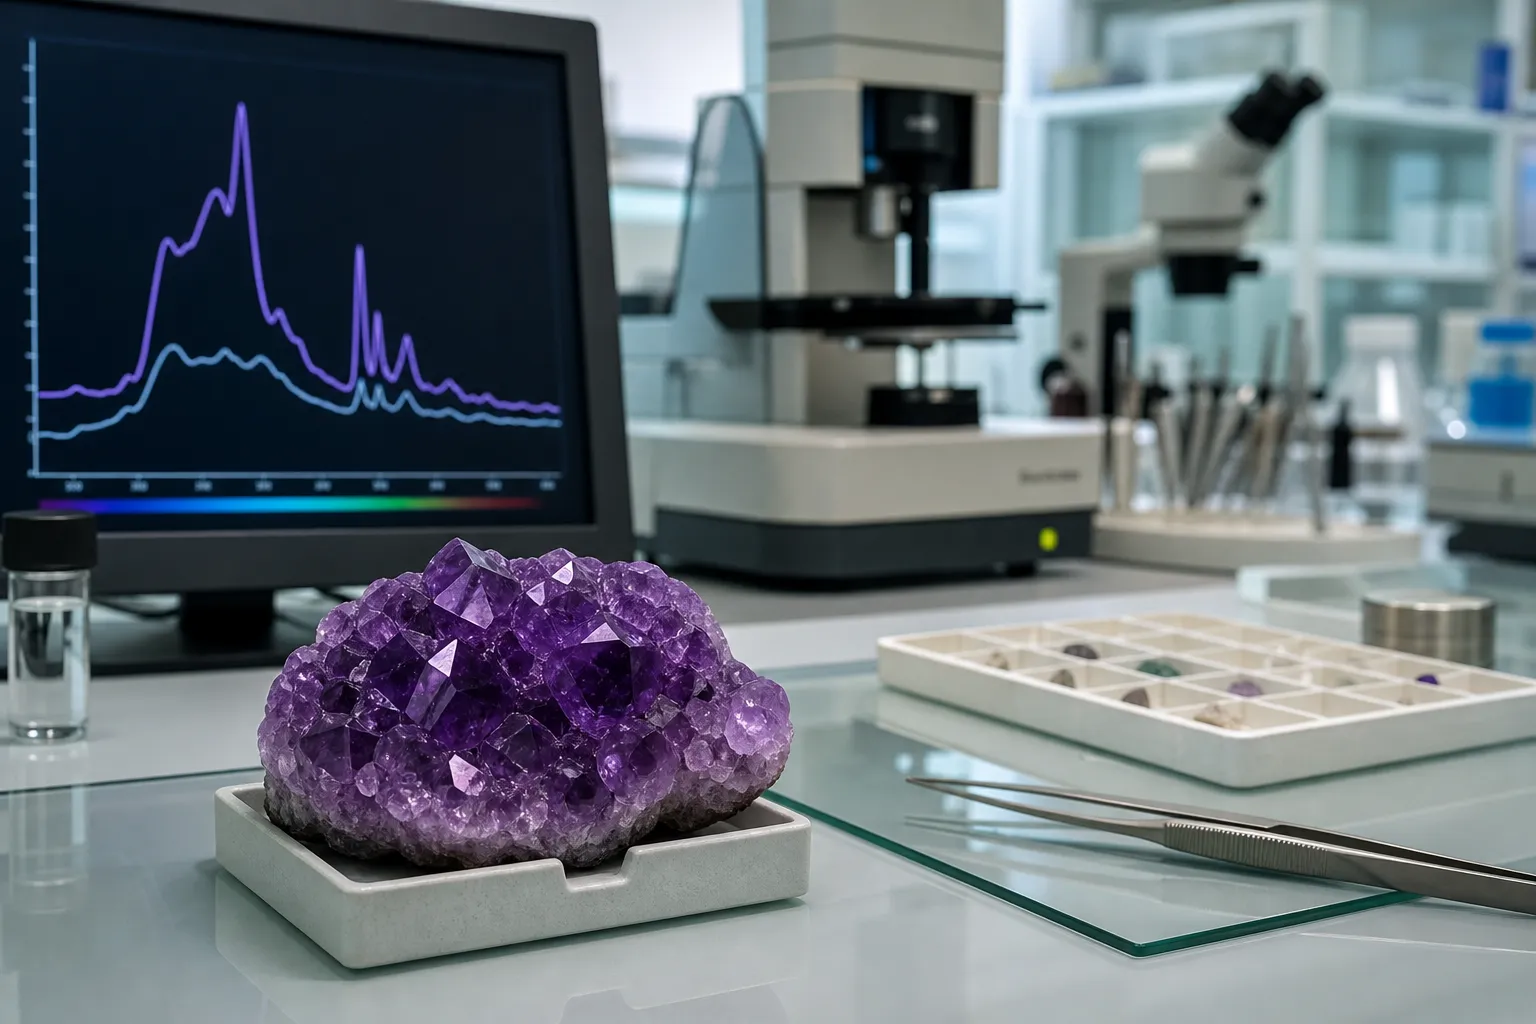
A violet crystal can look settled on a shelf and still carry a complicated material history. In a gem lab, spectroscopic baseline referencing turns that question into a controlled comparison: the lab records a spectrum from the unknown crystal, then checks it against reference spectra gathered under known conditions.
If the UV-Vis data shows unusual absorption peak shifts, unexpected peak broadening, FWHM differences, or a pattern that does not sit cleanly against the reference, those details may flag treatment-related anomalies for closer review. They do not, by themselves, prove that a crystal was treated.
That distinction matters for amethyst and other collectible specimens. A spectrum is not a seller promise, a visual inspection, or an authenticity switch. It is a measured pattern interpreted against a baseline.
broader context
Broader amethyst guide
This narrower page lands better after the broader amethyst context page.
What a Baseline Means Inside a Gem Lab
A spectroscopic baseline is the comparison point that gives a lab something meaningful to measure against. Without it, a line, curve, peak, or dip in a spectrum is only a shape on a graph. With a suitable reference spectrum, the lab can ask a better question: does this unknown crystal behave like material expected for its type and condition, or does it show differences that deserve more investigation?
For a collector, the plain-language version is this: the lab is not only asking, “What color does this amethyst appear to be?” It is asking, “How does this crystal interact with light compared with known or expected material measured in a similar context?”
In UV-Vis spectroscopy, the instrument records how a sample absorbs light across ultraviolet and visible wavelengths. The result may show absorption features: peaks, bands, shoulders, or broader regions. A gem lab spectrum review can then compare the unknown sample with controlled reference spectra, looking at feature position, relative strength, and shape.
The key word is comparison. Spectroscopic baseline referencing does not make a treatment conclusion appear automatically. It gives trained reviewers a disciplined way to notice differences that color alone may hide.
How UV-Vis Data Comparison Flags Possible Anomalies
When a crystal has been exposed to a treatment process, its spectral behavior may sometimes differ from an expected reference pattern. The available public source coverage supports that idea at a broad level: spectroscopy is used in gemological identification and treatment-evaluation contexts. It does not support exact cutoffs for treated crystal spectra in this article.
So the most accurate answer is narrow: UV-Vis data comparison can raise a question; it is not a standalone verdict.
Absorption peak shifts
A feature appears in a slightly different position than expected.
FWHM differences
A peak or band is broader or narrower than the comparison reference.
Intensity changes
A feature appears stronger, weaker, or differently shaped.
Pattern mismatches
Several features together do not align well with the controlled reference.
FWHM means “full width at half maximum.” In simpler terms, it describes how wide a peak is at a defined height. A narrow peak and a broad peak may sit in the same general region, but their shapes can still differ. In a lab setting, that shape difference may matter because treatment, composition, inclusions, sample thickness, orientation, and measurement conditions can all affect the spectrum.
For amethyst, where visible purple zoning, crystal habit, and display appeal often dominate the first impression, spectroscopy adds a more disciplined layer of observation. It does not replace the specimen’s visible character; it tests whether the measured behavior fits the expected context.
Why Measurement Conditions Matter
A spectrum is not only a property of the crystal. It is also the result of how the crystal was measured. That is why instrument settings context belongs inside the interpretation, not in a technical footnote.
A lab may need to consider calibration, wavelength range, sample placement, surface condition, thickness, orientation, and measurement geometry before deciding whether a spectral difference is meaningful. If two spectra were collected under different conditions, their differences may reflect the setup as much as the stone. A useful baseline is controlled enough to make the comparison fair.
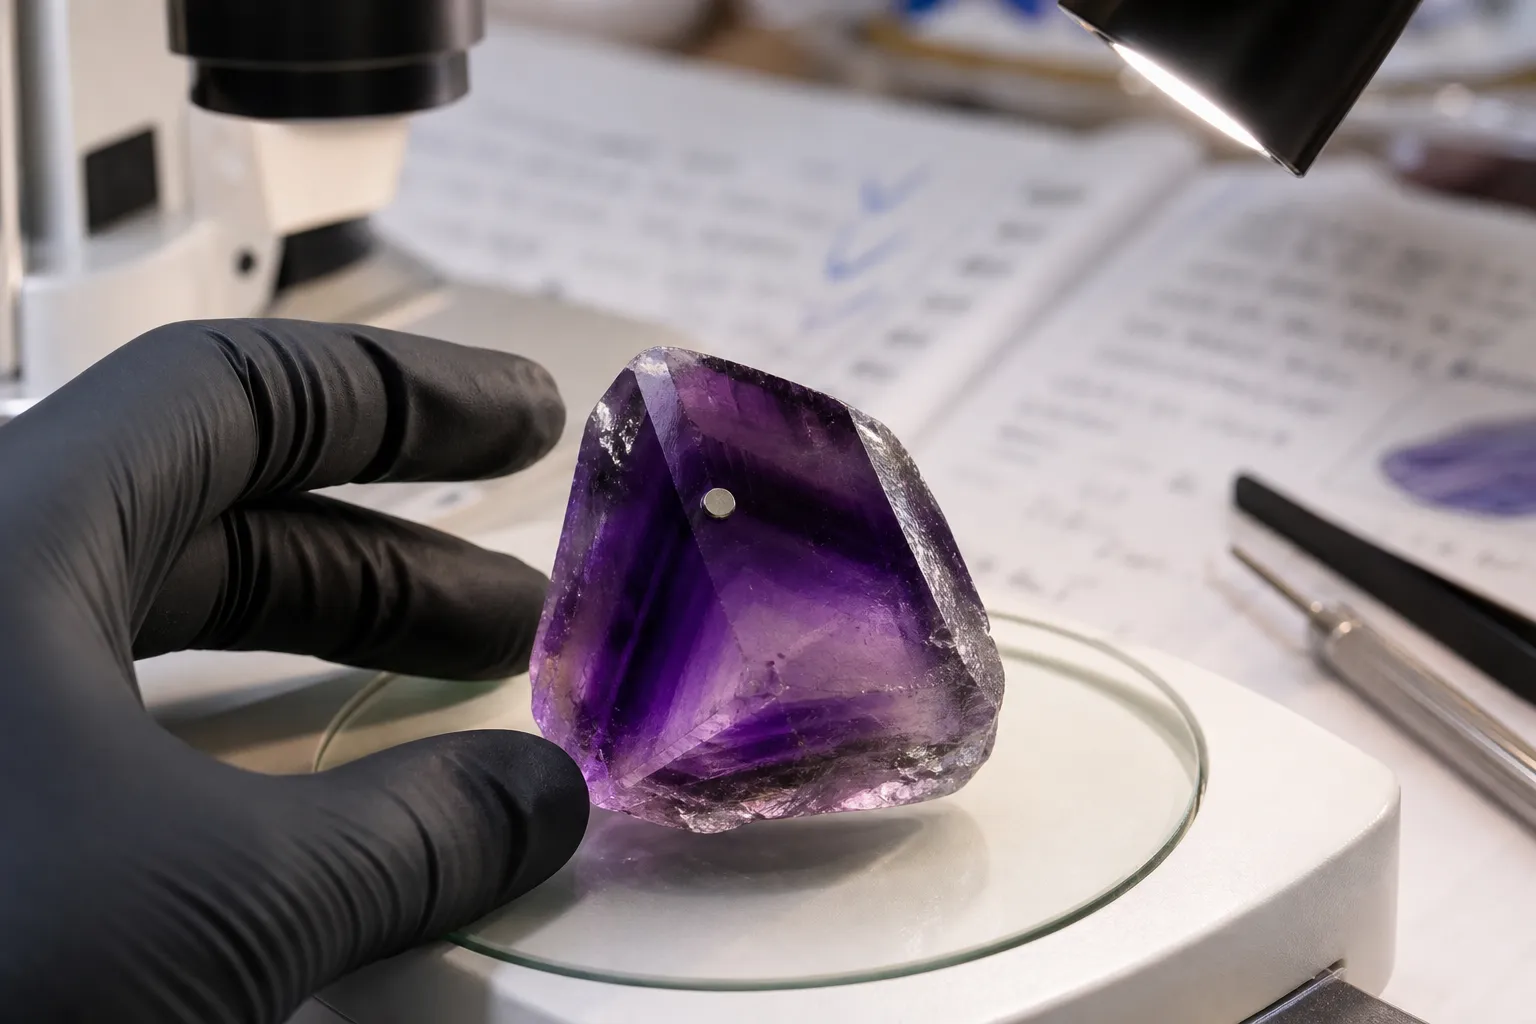
Sample condition effects can complicate the reading, too. A crystal with uneven color zoning may not produce the same result from every measured spot. A polished gem, rough point, cluster face, and chipped surface can present light differently. In amethyst, a single specimen may shift from saturated violet to pale lavender across its body. That does not automatically indicate treatment; it means the lab must know which part was measured and how.
This is why visual certainty can be risky. Bright color does not automatically mean enhancement. Natural-looking zoning does not automatically mean untreated material. Baseline comparison gives the question more structure, but the measurement still has to be interpreted within the condition of the sample.
What Peak Shifts and FWHM Differences Can Say
Absorption peak shifts and FWHM differences are best understood as “look closer” signals. They may suggest that an unknown spectrum does not match the expected reference cleanly. They may help separate ordinary variation from a pattern that deserves additional testing.
They cannot responsibly be used here as exact proof of a specific treatment, or as confirmation that a crystal is untreated. The supplied source material does not provide article-level experimental evidence, UV-Vis datasets, or diagnostic thresholds for that kind of claim.
That limit is part of the method. Gem materials vary. Spectra can be affected by composition, inclusions, structural features, orientation, and measurement context. Treatment may be one possible explanation for an anomaly, but it is not the only possible explanation.
A careful lab interpretation usually looks for agreement across more than one clue. If UV-Vis data shows an unusual pattern, the reviewer may ask whether the reference spectrum is appropriate, whether the instrument was calibrated, whether the sample condition explains the difference, and whether another method could add context.
For collectors, the useful question is simple: if a report or discussion mentions spectral anomalies, ask what the sample was compared against. “Different from what?” is the baseline question.
Where Raman and Photoluminescence Fit
Raman spectroscopy and photoluminescence can appear in gemological research and lab discussion, but they should not be treated as interchangeable with UV-Vis baseline work. Each method probes material behavior in a different way.
Raman can help examine vibrational information from a material. Photoluminescence records light emitted by a sample after excitation. UV-Vis focuses on absorption behavior across ultraviolet and visible regions. These methods may sit beside one another in a broader spectroscopy review, but a clue from one method does not automatically mean the same thing in another.
That matters when readers encounter confident treatment language. A seller, forum post, or casual discussion may collapse all lab spectra into one idea: “the machine showed it.” A more careful reading separates method from meaning. UV-Vis data comparison, Raman supporting evidence, and photoluminescence supporting evidence each need their own reference context and interpretation limits.
For amethyst, that separation keeps collector literacy clean. A crystal can be chosen for color, room atmosphere, or spiritual symbolism, while treatment status still requires sober material evidence. Symbolic use does not supply laboratory proof; laboratory clues do not decide personal meaning.
Common Confusion: A Baseline Match Is Not a Yes/No Switch
The common misunderstanding is that a lab spectrum works like a barcode. If it matches, the crystal is “natural”; if it does not, the crystal is “treated.” Real interpretation is less mechanical.
A close reference spectrum matching result can support consistency with expected material, but it does not erase every uncertainty. A mismatch can point toward treatment-related anomalies, but it can also raise questions about the chosen reference, measurement setup, or sample condition. One feature may be interesting; a pattern across features is usually more meaningful.
Another confusion is treating visible color as if it tells the same story as spectroscopy. Color matters to collectors and home display. It shapes desirability, rarity language, mood, and the way a specimen sits in a space. But color alone cannot carry the same burden as controlled spectral comparison.
A third confusion is using “spectroscopic” as one uniform label. UV-Vis, Raman, and photoluminescence do not answer the same question in the same way. A careful gem lab review chooses methods according to the material question, then weighs the results together.
The Evidence Limit for This Page
The public source coverage behind this article is thin. It supports a cautious framing: spectroscopy is part of gemological identification and treatment-evaluation practice, and baseline referencing can help a lab compare unknown spectra with controlled or expected references.
It does not provide enough support here for a specific treated-crystal case, exact absorption peak shifts, FWHM thresholds, or diagnostic cutoffs. Stronger claims would require stronger article-level sources from gemological, academic, museum, university, or standards-based literature.
So this page should not be read as a treatment-detection manual. It explains the logic of baseline comparison, not a recipe for deciding treatment status from one curve. The useful boundary is this: spectroscopic baseline referencing can make anomalies visible in a disciplined way, but the anomaly still needs context.
What to Look for in a Lab Explanation
If you are reading a report, article, or lab-style explanation about treated crystals, the most useful details are the comparison conditions.
Look for whether the explanation names the method, such as UV-Vis rather than a vague “spectroscopy” label. Look for whether the unknown spectrum was compared with controlled reference spectra or an expected reference pattern. Notice whether the discussion mentions instrument context, sample condition, and limits of interpretation.
Be cautious with claims that jump from one spectral feature to a total conclusion. A peak shift, broadened feature, or intensity mismatch may be important, but it needs a comparison frame. The lab question is rarely “Is there a strange line?” It is more often “Does this pattern remain unusual after the reference, setup, and sample are accounted for?”
For an amethyst collector, that restraint is practical. It separates material evidence from sales language, and it keeps a display specimen from carrying more certainty than the evidence can support.
Small FAQ
Can a spectroscopic baseline prove a crystal was treated?
Not by itself. A baseline comparison can flag treatment-related anomalies, but a responsible conclusion depends on reference spectra, measurement conditions, sample condition, method choice, and trained interpretation.
Is UV-Vis enough, or does a lab need Raman and photoluminescence too?
It depends on the question and the material. UV-Vis data comparison can be useful for absorption behavior, while Raman and photoluminescence may add different supporting evidence. They are adjacent tools, not interchangeable shortcuts.
Can I judge the same thing by looking at amethyst color?
No. Color zoning, saturation, and crystal habit matter for observation and display, but visible appearance is not the same as controlled spectral comparison. A purple crystal remains a specimen first; treatment claims need evidence beyond the shelf view.